Help Center Reporting Overview
What are different chart types?
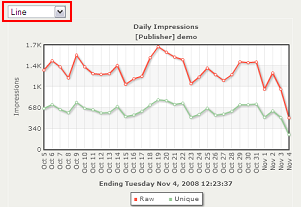
There are different chart types available (Area, Line, Column 2D, and Column 3D) when you view a report. To change the chart type instantly, you can choose a new type from the drop-down box on the top-left corner.Line Chart
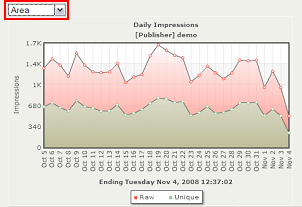
Area Chart
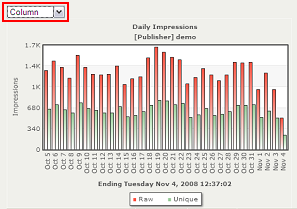
Column 2D Chart
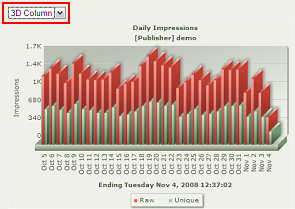
Column 3D Chart
You can also modify this setting in your account profile by following the menu My Account/Profile and click on the Settings tab.
Other Articles in Overview
Reports on impressions, clicks, geographical, and technical data
- How accurate is ad tracking and reporting?
- How can I exclude deleted entities from stats reports?
- How can I subscribe to RSS stats feeds?
- How do I change the reporting period?
- How do I compare between total and breakdown reports?
- How do I generate breakdown reports?
- How do I send the email statistic reports to my advertisers or myself?
- Overall Report
- What is a Report Trigger?
Cannot find an answer for your question? Ask our Customer Care team
Related
- How can I combine multiple ads in the same placement?
"For your convenience and better performance, you can display multiple ads in a zone using a single ad tag. Each ..."
- How do I use AdSpeed Ad Server in WordPress?
"In additional to the manual ad placement method, AdSpeed has released a plugin for WordPress, a popular publishing platform. This ..."
- How can I manage payments between publishers and advertisers?
"Publisher or ad network can manually create and send invoices to advertisers. When the advertiser places an advertising order using ..."
- Email Reports
"Instead of logging into your account on a daily basis to check on ad performance, you can schedule our ad ..."
- How do I change the reporting period?
"These are the steps to generate reports for ads, zones, groups, and advertisers. Basics, CTR, Conversion, and Revenue Reports Follow ..."